Visualizing 20 Years of Contractor Misconduct
POGO Federal Contractor Misconduct Database - All Misconduct" by Tamara Tershakovec. Visit the site to see the whole interpretation.
The Project On Government Oversight is celebrating the holiday season by sharing a colorful display of federal contractor misconduct over the last twenty years.
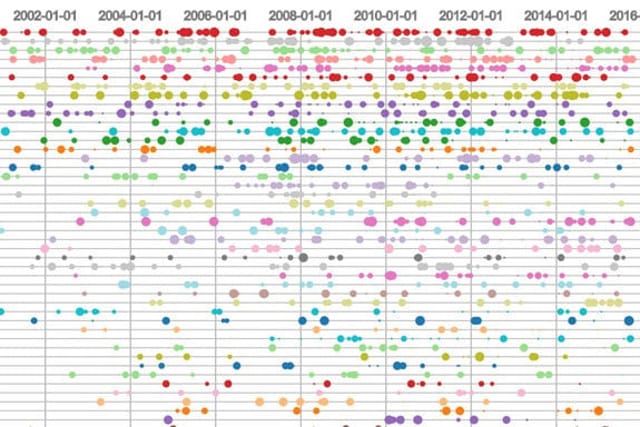
Using the new download feature on our Federal Contractor Misconduct Database (FCMD), data visualization developer Tamara Tershakovec created a JavaScript graph of the FCMD. The graph lists contractors in order of number of misconduct instances. Every instance is represented with a dot, the size of which correlates with the penalty amount. The dots fall along horizontal lines from earliest resolved instances (January 1995) on the left to the most recent on the right. Details about the instance pop up when you move the cursor over the dot. The gadget on the right side of the screen allows you to filter the graph by misconduct type.
The data download feature truly adds a new dimension to the FCMD. You don’t have to just write or read about the information in our database anymore. Now, with the raw data at your fingertips, you can easily extract it, analyze it, and display it in a completely new form. We hope Tershakovec’s interactive graph inspires others to use their technical and artistic skills on the FCMD to create new ways of understanding contractor misconduct.