Census Matters: Why an Accurate Count Is Essential to Funding Our Communities
The Census directs trillions of dollars to federal programs across the country. Here's what Census-directed spending looks like in your state.
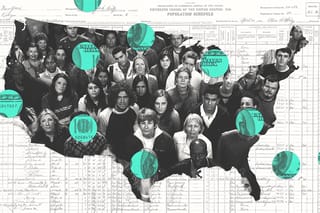
(Illustration: Ren Velez / POGO)
Introduction
The decennial census is one of the most impactful undertakings of our federal government. While many people know that the census count determines the number of Congress members each state can send to the U.S. House of Representatives, fewer recognize that it also performs another critical function: helping to direct federal spending.
In fact, census results inform the allocation of trillions of dollars in assistance funding from the federal government to states, districts, cities, and other localities. The census guides the geographic distribution of federal funding for health care, infrastructure, education, housing, veteran support, food for children and families, economic development, and much more.
But miscounts in the decennial census can send billions of dollars to the wrong places, depriving communities of the resources they need for an entire decade.1 The 2030 census is fast approaching, and with it, our next opportunity for an accurate count to help ensure the fair distribution of federal assistance funds.
That’s why the Project On Government Oversight (POGO) has created this report.
What We Found
To build a snapshot showing how census-driven funding flows from the federal government into our communities, POGO identified 371 federal assistance programs operating in fiscal year 2023 (the most recent year for which spending data is readily available for most programs) that relied on census data to geographically direct their funds.
POGO’s final list of 371 programs includes only those that use census data to allocate at least some portion of the federal funds they manage to a specific geographic location, such as a state, county, city, or zip code. For these programs, the accuracy of a state or local census count directly influenced the share of federal funds they provided to a state or locality.
We found these programs directed more than $2.24 trillion in federal dollars to state agencies, local governments, nonprofit organizations, educational institutions, companies, and households.
We’ve tracked this funding so elected officials, policymakers, and community leaders can better understand the stakes of a miscount in 2030 — and better recognize that ensuring an accurate census count is critical to ensuring their constituents are fully represented.
The goal of our research is to provide federal, state, and local census advocates the information they need to argue for an accurate, apolitical decennial census. This report expands and updates our 2023 report, Dollars and Demographics.
In addition to the national findings below, POGO has produced a fact sheet for every state, and the District of Columbia, that drills down into the census-guided spending directed to that state. We encourage census advocates to take data from this report most persuasive to their audiences and use them to make the case for a complete count in 2030.
The Importance of Accurate Census Data
-
As this report shows, trillions in federal assistance funds are distributed to states and local communities based on census data. Discrepancies in this data, whether in the form of undercounts or overcounts, can disrupt the equitable allocation of resources.
For example, programs aimed at supporting school children from low-income households or aiding unhoused veterans rely on an accurate representation of those groups. If the census undercounts those subgroups, the financial support the programs deliver will likely be insufficient to adequately address the community’s needs.
The consequences of overcounts can also be harmful. For example, overcounting a population in a rural community could cause it to be redefined by the federal government as no longer rural but urban. It would then be ineligible for programs designated exclusively for rural areas. While the change in designation would make urban-focused programs available, if the area is actually still rural the mistaken designation change would likely cost the area more in needed rural funding than it might provide in new, less relevant urban funding.
The impact of any miscount is as much a function of who gets miscounted as it is the size of the miscount.
The impact of a miscount also varies depending on how the programs use census data. Eligibility thresholds, such as those that determine whether an area is designated as rural or urban, are typically less sensitive to miscounts, except for those areas near the eligibility thresholds.
But formula allocations are often more sensitive to miscounts, especially if the miscounts affect a population a program is designed to serve. For example, Title I Grants to Local Education Agencies are determined by formulas that use the number of school-age children in households with incomes below the poverty level, so a miscount of children in low-income households in one geographic area could seriously affect the amount of federal education funding sent to that area.
Even if a miscount were to inadvertently direct additional funds to a state or community, this wouldn’t be a windfall. Most census-funded programs come with strict limitations on how the funds can be used. A community receiving more funds than they should through a program for housing or job training, then, could not divert excess funds toward programs in infrastructure or health care. More importantly, the misallocation of federal money to one community would mean another community goes without. Allocation of federal funds is a zero-sum game.
The complexity and variation in the use of census data also means the exact financial impact of any errors in the census count is difficult to accurately predict. While a “per capita” loss for each person miscounted would be a persuasive data point, the complex nature of federal funding programs and the ways they use census data make that figure impossible to calculate.2
-
The Census Bureau’s Post-Enumeration Survey, a follow-up survey that helps measure error rates in the decennial census results, found 14 states had statistically significant errors in statewide populations counted for the 2020 decennial census.3
Six states had significant undercounts. They are:
- Arkansas: undercounted by 5.04%;
- Tennessee: undercounted by 4.78%;
- Mississippi: undercounted by 4.11%;
- Florida: undercounted by 3.48%;
- Illinois: undercounted by 1.97%; and
- Texas: undercounted by 1.92%.
Eight states had significant overcounts. They are:
- Hawaii: overcounted by 6.79%;
- Delaware: overcounted by 5.45%;
- Rhode Island: overcounted by 5.05%;
- Minnesota: overcounted by 3.84%;
- New York: overcounted by 3.44%;
- Utah: overcounted by 2.59%;
- Massachusetts: overcounted by 2.24%; and
- Ohio: overcounted by 1.49%.
These states should be particularly concerned about the potential impact their inaccurate census count will have on the amount of federal funds coming to their communities under these programs.
That is not to say, however, that the remaining 36 states can be confident they received the right amount of federal funds. The Post-Enumeration Survey found that every U.S. state had a measurable under- or overcount. Most errors weren’t large enough to be deemed statistically significant, but that does not mean they didn’t impact any of the program funding that relied on the census data collected.
The Census Bureau only estimates state-wide error rates. But many federal programs use census data to allocate funds directly to more local communities, like counties, cities, or school districts.
As a result, any state could have regional under- or overcounts that are not large enough to be statistically significant for the whole state but that will impact federal funds allocated directly to areas within the states. This is especially true for areas within a state that have larger “hard-to-count” populations.
-
The U.S. Census Bureau has identified several populations that it has historically found hard to count. According to the bureau, these include:
- Young children under the age of five
- Highly mobile people
- Racial and ethnic minorities
- Non-English speakers
- Low-income people
- People experiencing homelessness
- Undocumented immigrants
- LGBTQ people
- People with mental or physical disabilities
- People who do not live in traditional housing.4
It’s important to note that there is significant overlap between the communities that the Census Bureau has designated “hard to count” and the communities that many of the programs we traced for this project are designed to serve.
These programs use census data to geographically direct funds to historically marginalized communities, including people with self-reported incomes under the federal poverty line, people living in rural communities, elderly people, people with disabilities, and Black, Indigenous, and other people of color.
To ensure that federal funding reaches the communities for which it’s intended, then, it’s critical that states, counties, and cities with significant “hard to count populations” work with the U.S. Census Bureau to intensify outreach efforts, strengthen participation, and avoid undercounts in the census process.
How the Census Shapes Spending
POGO’s final list of programs includes only those that use census data to allocate at least some portion of federal funds managed by the program to specific geographic locations. In other words, 371 programs where the accuracy of the census count at subnational level (such as state, county, city, or zip code) influenced the share of federal funds that were received locally.
Specifically, these programs use census data in four main ways to help guide funding:
- Eligibility criteria – the use of census data to determine which locations or recipients may receive funds from a program. For example, the Rural Rental Assistance program is restricted to rural areas, which is determined by census population data.
- Allocation formulas – the use of census data within a program formula to determine the level of funding a location or recipient receives. For example, the Social Services Block Grant program allocates funds to each state based on the state’s population relative to the population of the whole country.
- Application evaluations – the use of census data to score or prioritize funding applications. For example, the Middle Mile (Broadband) Grant Program prioritizes underserved and high-poverty communities with specific points available to applications that demonstrate substantial benefits going to such counties.
- Loan interest rates – some federal assistance loan programs use census data in setting the interest rates on the loans they offer or guarantee. For example, the U.S. Department of Agriculture’s Community Facilities Direct Loan & Grant Program sets interest rates based on the median household income and population of an area.
Types of Spending
POGO assigned each of the programs we identified into one (or more) of six major categories: Medicare and Medicaid, Health, Infrastructure, Education, Economic Development, and Housing. Here’s what we found:
$1.65 trillion in census-guided Medicare and Medicaid spending occurred in FY 2023. These programs provide millions of Americans with health insurance and assistance in paying for medical services, prescription drugs, surgeries, hospital stays, and more.
$261.23 billion in census-guided Health spending occurred in FY 2023. These programs assist households with medical costs, and they provide nutritional support, social services, community health centers, and more.
$125.28 billion in census-guided Infrastructure spending occurred in FY 2023. These programs provide funds for roads, bridges, energy production, broadband, water treatment, and other community infrastructure projects.
$129.8 billion in census-guided Education spending occurred in FY 2023. These programs support primary education, special education, and higher education, as well as training and education for community members.
$56.59 billion in census-guided Economic Development spending occurred in FY 2023. These programs provide loans for business expansions, small business assistance, employment services for workers, and other efforts to improve the economic well-being of communities.
$91.57 billion in census-guided Housing spending occurred in FY 2023. These programs assist homeowners and renters with housing costs, invest in public housing improvements, and help veterans, the elderly, people with disabilities, and others find affordable housing.
Since many federal programs address multiple issues, most of these categories are non-exclusive. This means that one program (and its full funding) may appear in more than one category. Users of this data should therefore avoid tallying up category totals, as the total would exceed the full amount of census-guided spending tracked for FY 2023.
For example, the Distance Learning and Telemedicine Loans and Grants program was categorized under “education,” “health,” and “infrastructure,” given its focuses on distance learning, telemedicine, and broadband improvements.
Medicare and Medicaid spending is the only exclusive category. Given the exceptional size of these programs, they are considered separately and are excluded from the remaining categories to facilitate a clearer understanding of the scale of census-guided spending within each of the other categories.
Spending by State
Our research showed that the distribution of funds varied significantly across states. Predictably, states with larger populations, like California, New York, and Texas, received the highest amounts.
But previous research by The George Washington University found that the primary determinants of the differences in census-guided funding between the states is not the raw population of each, but rather each state’s poverty rate and the percentage of its population living in rural areas.5 This connection is grounded in the fact that many of the federal assistance programs that rely on census data to direct funds to specific locations are targeted to aid low-income households and rural areas.
To generate state breakdowns of federal funds geographically directed by census data, POGO collected detailed data on the geographic distribution of funds for as many of the identified programs as possible. However, there were still programs for which reliable data was not available; in these cases, we used a methodology to estimate how much each state received based on the average rate of payments to each state for all the programs with detailed spending data.
POGO has long advocated for needed improvements to the completeness and accuracy of spending data available on USAspending.gov so the database can reliably track spending for more programs with exact figures. Until such improvements occur, state distribution estimates for many programs remain a necessity to evaluate the impact of census data on the geographic distribution of federal funds.
The table below lists the amounts distributed to each state through programs that use census data to geographically direct the funds, with the amounts for Medicare and Medicaid listed separately, as they are by far the largest programs for each state.
For more details on census-funding spending in each state, including breakdowns by spending on health, infrastructure, education, economic development, and housing, please see the state fact sheets above.
Federal Programs Geographically Directed by Census Data
Our research also showed a wide range of programs that use census data in their allocation of funds — from large entitlement programs such as Medicaid, Medicare, and the Supplemental Nutrition Assistance Program, to smaller, more targeted programs such as Appalachian Local Development District Assistance, Intercity Bus Security Grants, and the Rural Violent Crime Initiative.
The breadth of programs means that almost every public service communities rely on has some link to census-guided funds: agriculture, public safety, environmental protection, services for veterans or the elderly, and more. While the main categories featured in this report represent the largest impacts, census-guided federal funds reach far more topics and concerns.
The high level of funding to the large entitlement programs means that census-guided funding is fairly concentrated. The 10 largest census-guided programs account for 85.6% of the census-guided spending in FY 2023. This is largely driven by the high spending levels for the Medicare and Medicaid programs. Those programs are also a major factor in why the Department of Health and Human Services represents such a large portion of the census-guided federal assistance, accounting for 78.9% of the funds on this list.
The table below lists each of the 371 federal financial assistance programs that we have determined to be geographically directed by census data.
The list is sorted to display the programs with the largest spending first.
Previous Research
Census Matters expands and updates POGO’s 2023 report, Dollars and Demographics: How Census Data Shapes Federal Funding Distribution. That report identified 338 assistance programs that relied on the census to geographically distribute more than $2.1 trillion during the 2020 fiscal year.6
Dollars and Demographics built on previous research conducted by both The George Washington University and the U.S. Census Bureau, as noted in the table below:7
Methodology
-
Federal Funds Information for States (FFIS)
The FFIS is an organization that tracks and analyzes more than 90% of federal funds flowing to state and local governments. The organization shared its FY 2023 spending data with POGO on the condition that program-specific spending amounts by state not be published. POGO sourced spending amounts for 26 programs from the FFIS data covering $35.73 billion, or about 1.6% of the funding tracked in this report.
Spending data for some federal assistance programs tracked by FFIS is split into sub-programs or activity areas. POGO combined these sub-program spending amounts into single spending totals in each state for each program.
USAspending.gov
The website USAspending.gov is the primary portal to access federal award data, including contracts, grants, direct payments, and loans. POGO sourced spending data for 167 programs from USAspending.gov covering $298.83 billion in spending, or about 13.3% of the funding tracked in this report.
For most programs, POGO used the place of performance for prime awards to calculate spending totals for each state; for five programs, recipient location was used instead of place of performance to identify the state location. These were programs for which the place of performance data did not include a specific state, likely because these programs awarded funds to intermediary entities such as banks or financial institutions that could potentially use the funds for activities beyond the state where they were located. POGO opted to use the state location of the recipients, as it was likely that is where most of these funds were used.
For programs that included loans and loan guarantees, POGO used the face value of those loans as the spending amount since it best represents that amount of assistance being provided.8
Assistance Listings
The Assistance Listings (previously the Catalog of Federal Domestic Assistance) is an annual government-wide compendium of federal programs, projects, services, and activities that provide assistance or benefits to the American public. POGO sourced FY 2023 spending totals for 93 programs from the FY 2024 catalog covering $22.4 billion in spending, or about 0.8% of the funding tracked in this report.
POGO estimated state-level spending data for these 93 programs based on the total FY 2023 spending reported for each program and on the observed rate of spending in each state for the 274 programs for which detailed state spending data was available. Both Medicare and Medicaid were excluded from the rate of spending calculation because the large spending amounts would significantly skew the average.
Agency Sources
Spending data posted by the agencies overseeing those programs were used to produce state specific allocation totals for many programs. These sources included agency-based award datasets, budget materials, program reports, and more. POGO sourced spending data for 85 programs from agency sources covering $1.89 trillion in spending, or about 84.4% of the funding tracked in this report (see table “List of Agency Sources” below).
Medicare
POGO sourced state-level spending for Medicare Parts A and B from the Centers for Medicare and Medicaid Services’ “Geographic Variation in Standardized Medicare Spending – State” dataset.9 The dataset includes state-level spending for Parts A and B, but only for those beneficiaries who were fully enrolled in all parts for the whole year. This accounted for just under half of all Medicare beneficiaries in 2023.
POGO used the state distribution pattern for the spending covered in this dataset and applied it to the full level of Medicare spending reported for the year in the 2024 Annual Report of the Board of Trustees of the Federal Hospital Insurance and Federal Supplementary Medical Insurance Trust Funds.10
POGO sourced state-level spending for Medicare Part D from the dataset “Medicare Part D Prescribers – by Geography and Drug.”11 The total drug cost data was aggregated for each state. Users should note that the total drug cost in this dataset does include costs beyond the federal spending, such as ingredient costs, dispensing fees, sales tax, and more. To estimate the federal funds this program directed to each state, POGO used the state percentage of spending from this dataset and applied it to the total national spending for Medicare Part D as reported for the year in the 2024 Annual Report of the Board of Trustees of the Hospital Insurance and Federal Supplementary Medical Insurance Trust Funds.12
Medicaid
POGO sourced state-level spending data for Medicaid from “Exhibit 16: Medicaid Spending by State, Category, and Source of Funds, FY 2023 (millions)” from Medicaid and CHIP Payment and Access Commission’s MACStats: Medicaid and CHIP Data Book.13
For any questions on data sources or methodology please contact POGO at [email protected]