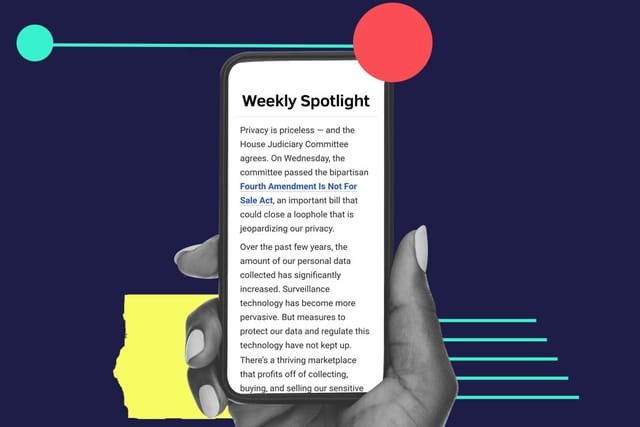
Dollars and Demographics: How Census Data Shapes Federal Funding Distribution
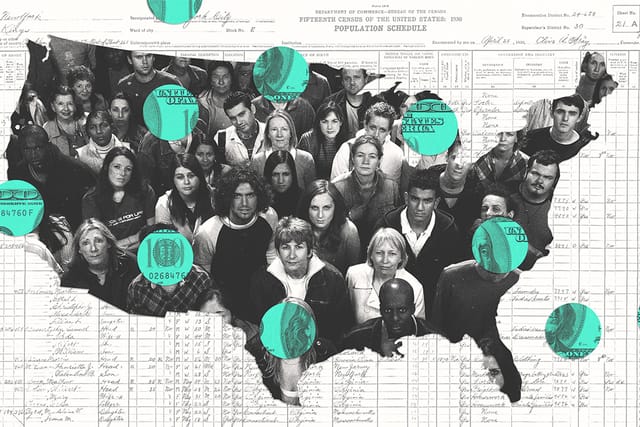
POGO identified 338 federal assistance programs that relied on census data to direct more than $2.1 trillion in federal funds to states and communities in fiscal year 2020. Proper distribution of those funds depends on the reliability of census data.
(Illustration: Renzo Velez / POGO)
The decennial census is a vitally important information gathering effort. Every 10 years, the Census Bureau must accurately and fairly count all people living in the country — not just citizens, but everyone. It’s one of the few government actions spelled out in the Constitution and has been conducted in one way or another since the United States was formed. The goal is to count everyone, only once, and in the right place. During the intervening years between decennial censuses, smaller, targeted surveys update various demographic data points, but these data collections still rely on the decennial numbers as the established baseline.
The federal government relies heavily on the data in several important ways. It allocates seats in the House of Representatives based on the decennial census results. It also uses the data to help direct trillions of dollars in federal assistance to states and communities. Those funds are used for hospitals, roads, schools, housing, supporting veterans, feeding children and families, economic development, and so much more. Agencies use census data for program evaluation and evidence-based policymaking. It is therefore essential to get accurate decennial census counts, yet numerous states had statistically significant errors in their 2020 decennial numbers.
The goal of the Project On Government Oversight’s (POGO) research is to demonstrate how much federal spending is guided by census data. Decision-makers and community leaders can then determine what level of support they give to the census effort, particularly those that have large communities that are hard to count.
An inaccurate census count can send billions of dollars to the wrong locations. That possibility may convince those in power to put aside partisan politics and focus on ensuring a full and accurate decennial census. Elected officials should see assisting an accurate census count as part of their role to ensure their constituents are fully represented in Washington, DC, and that communities in their districts receive all the funds that should rightfully go to them.
An inaccurate census count can send billions of dollars to the wrong locations.
POGO has focused on the role the census plays in geographically directing federal funds, beyond simply identifying how many federal programs used census data in some way. This will help provide greater context for the findings in a recent U.S. Census Bureau report that examined all federal programs that used census data in some way (see more below).
What We Found
POGO identified federal assistance programs operating in fiscal year (FY) 2020 that relied on census data to geographically direct more than $2.1 trillion in federal funds to state agencies, local governments, nonprofit organizations, educational institutions, companies, and households. POGO’s final list of 338 programs only included those programs that used state or local census data to allocate at least some portion of federal funds managed by the program to those geographic locations. In other words, 338 programs where the accuracy of the census count at subnational level (such as state, county, city, or zip code) influenced the share of federal funds that were received locally.
-
POGO identified the programs through a review of federal sources including
- the Catalog of Federal Domestic Assistance;
- the Code of Federal Regulations;
- the U.S. Code;
- program guidance and agency materials; and
- Congressional Research Service reports.
The FY 2020 spending amounts for each program come from various sources. Generally, we relied on four primary sources for the spending data included in this report:
- Federal Funds Information for States
- USAspending.gov
- Single Audit Resource Center
- Catalog of Federal Domestic Assistance
For more information on the sources of spending data, see the section on data sources at the end of this report.
The list expands and updates the federal programs reported as census-guided in 2017 in the George Washington University Institute of Public Policy’s “Counting for Dollars 2020 Brief 7: Comprehensive Accounting of Census-Guided Federal Spending (FY 2017),” which identified 305 assistance programs distributing just under $1.5 trillion.1
Several programs included in the 2017 Counting for Dollars brief were removed from POGO’s updated list (see full list below) because they had either been cancelled or were spending zero federal funds in FY 2020. Several dozen new programs were added, including programs that didn’t exist during the period reviewed in the previous brief.
The identified programs used census data in a variety of ways during the allocation process. For example, some used census data (or census derived data) to determine eligibility for geographic areas or specific households, such as when programs restricted to rural areas use population density thresholds to determine which areas qualify as rural and are therefore eligible to participate. Other federal programs used the data such as total population, per-capita income, and school age children below poverty level in formulas to allocate funds to areas. Still others used the data to evaluate and score applications based on program priorities such as reaching smaller towns or poorer communities.
Trillions in federal program funds go to states and communities, and the correct distribution of those funds hinges on the reliability of census data.
Some of the program allocations based on census data are more sensitive to miscounts. For example, eligibility thresholds such as those that determine rural or urban designations will not be very sensitive to miscounts except for those communities near the threshold. But formula allocations will be far more sensitive to a miscount, especially if the miscount occurs in a population that’s the focus for a program. For example, Title I Grants to Local Education Agencies are determined by formulas that heavily use the number of school age children below the poverty level, so a miscount of children in low-income households would greatly sway the amount sent to a geographic area.
Importance of Accurate Data
Understanding the amounts of money going to each state that relies on census data to help distribute the funds geographically is critical to appreciating the importance of an accurate census: Trillions in federal program funds go to states and communities, and the correct distribution of those funds hinges on the reliability of census data. Any discrepancies in this data, whether in the form of undercounts or overcounts, have the potential to disrupt the equitable allocation of resources. These errors could lead to communities being denied their rightful portion of federal funding, thereby impeding their ability to address crucial needs and foster development.
Many of the programs on our list are designed to extend assistance to geographic areas based on the presence of distinct population subgroups. For instance, programs aimed at supporting school children from low-income households or aiding unhoused veterans rely on an accurate representation of those groups. However, if the census process were to undercount such subgroups, the financial support the programs deliver might be insufficient to adequately address the community’s needs. The impact of any miscount is as much a function of who gets miscounted as it is the size of the miscount. And as we discuss later, there is a troubling overlap between the populations that the Census Bureau has found hard to accurately count and the groups that many of these programs seek to help.
It is also crucial to recognize that even if a miscount were to inadvertently direct additional funds to a state or community, this shouldn't be regarded as a triumph or windfall.
The consequences of overcounts are also harmful to the allocation of federal funds. An overestimation of a population within an area could inadvertently lead to the reduction or complete loss of federal funding. For example, imagine a rural community experiencing an overcount of its population, causing it to be defined as urban. Consequently, this community might become ineligible for funds designated exclusively for rural areas. This outcome not only deprives the community of critical financial support but also highlights how inaccuracies in census data can distort the intended outcomes of federal programs.
It is also crucial to recognize that even if a miscount were to inadvertently direct additional funds to a state or community, this shouldn't be regarded as a triumph or windfall. Allocation of federal funds is a zero-sum game. First, the misdirection of funds would result in another community or multiple communities being deprived of the funds they should have received within the context of the federal program. Second, most of these programs come with strict limitations on how the funds can be used. Hence, a community receiving more funds than they should through a program for housing or job training, for instance, cannot divert these excess funds toward endeavors like infrastructure or health care. So the community is left with the quandary of either squandering the funds on superfluous projects within the program’s focus or leaving the funds largely unspent. In either scenario, the overallocated funds yield far less benefit for the community than one might first imagine.
The complexity and variation in the use of census data means the exact financial impact of any errors in the census count is difficult to accurately predict. The impact of an overcount or undercount largely depends on what population is miscounted and where the miscount occurs.
Equity Concerns
The link between census data and federal aid programs is more than just a matter of accuracy; it is also a matter of fairness and equity. Many of the federal assistance programs identified by POGO as geographically directing funds based on census data are lifelines of support for communities that have historically been marginalized and are often most in need, such as people struggling to make ends meet, rural communities, elderly people, people with disabilities, and Black, Indigenous, and other people of color. Any inaccuracy within the census count could prevent needed aid from reaching its intended recipients, people who may face the most severe consequences from missing this financial support.
Concerningly, there is real overlap between the target communities for these programs and the populations that the Census Bureau has historically found hard to count, which include people of color, ethnic minorities, people in low-income communities, people experiencing homelessness, immigrants, people with disabilities, LGBTQ+ people, and others.2 The difficulty of accurately counting these communities derives from several socioeconomic, cultural, and logistical factors, including language barriers, limited access to technology, poor address records, and distrust of the government.
States, counties, and cities with significant hard to count populations should work with the Census Bureau to intensify outreach efforts to these communities and ensure stronger participation in the census process. If the census falls short in accurately counting these groups, the financial backing the programs provide might prove insufficient to address the challenges the communities face. This outcome not only threatens the advancement of these often-marginalized communities but also perpetuates societal cycles of inequity.
State Breakdowns
To generate state breakdowns of federal funds geographically directed by census data, POGO collected detailed spending data for as many of the identified programs as possible. However, there were still programs for which reliable data on the distribution of funds was not available. In those cases, POGO used a methodology to estimate how much each state got based on the average rate of payments to each state for all the programs with detailed spending data.
POGO has long advocated for needed improvements to the completeness and accuracy of spending data available on USAspending.gov so the database can reliably track spending for more programs with exact figures.3 Until such improvements occur, state distribution estimates for many programs remain a necessity to evaluate the impact of census data on the geographic distribution of federal funds.
The distribution of funds varied significantly across states. States with larger populations, like California, New York, and Texas, received the highest amounts. But previous research by the Counting for Dollars project revealed that the primary determinants of the differences in census guided funding between the states is each state’s poverty rate and percentage of its population living in rural areas, rather than raw population.4 This connection is grounded in the fact that many of the federal assistance programs that rely on census data to direct funds to specific locations are targeted to aid low-income households and rural areas.
It should be noted that the Census Bureau’s Post-Enumeration Survey, a follow-up survey that helps measure error rates in the decennial results, found 14 states had statistically significant errors in statewide populations counted for the 2020 decennial census.5 Six states had significant undercounts and eight states had significant overcounts. These states should be particularly concerned about the potential impact their inaccurate census count will have on the amount of federal funds coming to their communities under these programs.
However, that is not to say that the remaining 36 states can be confident they received the right amount of federal funds. Each state had a measurable under- or overcount in the Post-Enumeration Survey. Most simply weren’t large enough to be deemed statistically significant. That doesn’t mean the errors didn’t impact any of the program funding that relied on the census data collected.
Additionally, the Census Bureau only estimates state-wide error rates. But many federal programs use substate census data to allocate funds directly to more local communities, like counties, cities, or school districts. As a result, any state could have regional under- or overcounts that are not large enough to be statistically significant for the whole state but that will impact federal funds allocated directly to those substate areas. This is especially true for areas within a state that have larger numbers of hard to count populations.
In the table below, we’ve listed the amounts distributed to each state through programs that use census data to geographically direct the funds, with the amounts for Medicare and Medicaid listed separately as they are by far the largest programs for each state. The Medicare column includes funds for Parts A, B, and D, each of which is a separate federal program. Payments for Medicare Part C are reported within Parts A and B, instead of as a standalone program.
Agency Breakdown
The identified FY 2020 assistance programs with funds geographically directed by census data were overseen by 24 federal agencies and offices. Almost 90% of the federal assistance funds came from just three agencies: Department of Health and Human Services, Department of Agriculture, and the Treasury Department.
While the top three agencies accounted for a substantial majority of the federal funds geographically directed by census data, seven other federal agencies had more than $1 billion in assistance spending for FY 2020.
Spending Data Sources
POGO pulled the FY 2020 spending amounts for each program from various sources. Generally, we relied on four primary sources for the spending data included in this report.
- Catalog of Federal Domestic Assistance (CFDA): The CFDA is an annual government-wide compendium of federal programs, projects, services, and activities that provide assistance or benefits to the American public. POGO sourced FY 2020 spending totals for 172 programs from the FY 2021 catalog.
- Federal Funds Information for States (FFIS): The FFIS is an organization that tracks and analyzes more than 90% of federal funds flowing to state and local governments. The organization shared its FY 2020 spending data with POGO on the condition that program-specific spending amounts by state not be published. POGO sourced spending amounts for 108 programs from the FFIS data.
- USAspending.gov: The website USAspending.gov is the primary portal to access federal award data, including contracts, grants, direct payments, and loans. POGO sourced spending data for 39 programs from USAspending.gov.
- Single Audit Resource Center (SARC): The SARC is an organization that collects publicly available audit data and is focused on improving the efficiency and quality of audits and accounting of federal dollars. POGO sourced spending data for 15 programs from the SARC data.
For a small number of programs, the primary sources did not provide a reliable estimate of the FY 2020 spending so additional sources were used.
- 2021 Annual Report of the Boards of Trustees of the Federal Hospital Insurance and Federal Supplementary Medical Insurance Trust Funds: POGO sourced FY 2020 total spending for Medicare programs from Table II B1 in the annual Medicare report.
- MACStats: Medicaid and CHIP Data Book: POGO sourced Medicaid FY 2020 spending totals from Exhibit 16, titled “Medicaid Spending by State, Category, and Source of Funds.”
- Delta Regional Authority FY 2021 Budget Justification: POGO sourced FY 2020 spending data for the States’ Economic Development Assistance Program from the Delta Regional Authority’s FY 2021 budget justification.
- Congressional Research Service Report – Small Business Administration Trade and Export Promotion Program: POGO sourced FY 2020 spending data for the 7(a) Export Loan Guarantees program from Table 3, titled “SBA Export-Related Loan Approval Amount, FY 2015-FY 2021.”
- HHS’s Tracking Accountability in Government Grants System (TAGGS): POGO sourced FY 2020 spending data for the Rural Health Research Centers program from the Department of Health and Human Service’s grants tracking system.
- Administration for Children and Families Operating Plan for FY 2021: POGO sourced FY 2020 spending data for the Title IV-E Kinship Navigator Program from the FY 2021 operating place for the Administration for Children and Families.
Methodology for Calculating State Totals
Medicare
POGO sourced state-level spending for Medicare Parts A and B from the Centers for Medicare and Medicaid Services’ (CMS) Table 5, “Medicare Part A and Part B Summary: Persons With Utilization, Program Payments, and Cost Sharing for Original Medicare” of the “CMS Program Statistics – Medicare Part A & Part B – All Types of Service for 2020.”6
POGO estimated state-level spending for Medicare Part C using the total Medicare spending reported in the 2021 Annual Report of the Board of Trustees of the Hospital Insurance and Federal Supplementary Medical Insurance Trust Funds and the rates of state-level spending reported for Parts A and B.7 Total spending on Part C in 2020 equaled 88.4% of combined Parts A and B spending reported in all the states. POGO projected that since Part C is mixed in with Parts A and B, the state breakdown of spending for Part C would follow the same rate in each state as observed for Parts A and B and therefore applied the 88.4% to each state’s allocation of Part A and B to account for Part C.
POGO sourced state-level spending for Medicare Part D from Table 7, “Medicare Part D Utilization: Average Annual Prescription Drug Fills and Average Annual Gross Drug Cost Per Part D Utilizer, by Type of Plan, by Area of Residence” of “CMS Program Statistics – Medicare Part D.”8
POGO calculated state-level spending for COVID-19 Accelerated and Advanced Payments based on the amounts and state locations listed for recipients in the “Provider Relief Fund & Accelerated and Advance Payments” database posted by the Centers for Disease Control and Prevention.9
Medicaid
POGO sourced state-level spending data for Medicaid from “Exhibit 16: Medicaid Spending by State, Category, and Source of Funds, FY 2020 (millions)” from Medicaid and CHIP Payment and Access Commission’s MACStats: Medicaid and CHIP Data Book.10
Federal Funds Information for the States
POGO sourced state-level spending data for 108 programs from Federal Funds Information for the States data. For five programs included on this list, the FFIS data reported the state spending amounts combined with other closely related programs.11 POGO estimated the state spending shares for the individual programs using the total spending of each program (as reported in the Catalog of Federal Domestic Assistance) to determine the percentage each program accounted for in the combined spending. POGO applied those percentages to the combined FFIS state spending amounts to estimate the spending share of each individual program.12
USAspending.gov
POGO sourced state-level spending data for 39 programs from the USAspending.gov website. POGO used the recipient location for prime awards to calculate spending totals for each state. For programs that included loans and loan guarantees, POGO used the face value of those loans as the spending amount since it best represents that amount of assistance being provided. The government sometimes uses a value called the Loan Subsidy Cost as the measure of its spending on loan awards. The Loan Subsidy Cost, which is always significantly lower than the face value of each loan, attempts to estimate the loan’s likely cost to the government based on a variety of factors such as size of the loan, the interest rate, and risk of full or partial default.
Single Audit Resource Center
POGO sourced state-level spending data for 15 programs from the Single Audit Resource Center. POGO totaled the amounts reported as received based on the state listed for each recipient.
Agency Data
POGO sourced state-level spending data for two programs from agency program data.
- Data from HHS’s Tracking Accountability in Government Grants System provided state spending totals for the Rural Health Research Centers program.
- POGO used state breakdown tables from HHS on the various components of the Provider Relief Fund to calculate the state-level spending for that program.
Catalog of Federal Domestic Assistance and Other Sources
POGO estimated state-level spending data for 170 programs based on total FY 2020 spending reported for each program and on the observed rate of spending in each state for the 164 programs for which detailed state spending data was available. Both Medicare and Medicaid were excluded from the rate of spending calculation because the large spending amounts would significantly skew the average.
- The Catalog of Federal Domestic Assistance provided the FY 2020 spending for 167 of these programs. POGO sourced FY 2020 spending totals for three programs from other materials.
- POGO sourced FY 2020 spending totals for the States’ Economic Development Assistance Program from the Delta Regional Authority’s budget justification to Congress for FY 2021.13
- POGO sourced total FY 2020 spending for 7(a) Export Loan Guarantees program from Table 3 of the Congressional Research Service report, Small Business Administration Trade and Export Promotion Programs.14
- POGO sourced the FY 2020 spending total for the Title IV-E Kinship Navigator Program from the Administration for Children and Families’ operating plan for FY 2021.15
POGO’s Analysis Differs from the Census Bureau’s Recent Report
As POGO was conducting its study, the Census Bureau released a report, Uses of Decennial Census Programs Data in Federal Funds Distribution: Fiscal Year 2021, which identified 353 federal programs that used census data in their allocation of more than $2.8 trillion of federal funds in FY 2021.16
POGO’s study differs from that report in several important ways.
In their report, the Census Bureau included programs that used census data in determining adjustments to overall funding levels for programs or national eligibility thresholds, even if the programs did not use the data to help determine different funding levels for specific geographic areas. For example, some programs use census data to determine overall funding amounts or national eligibility thresholds. But for such programs a census miscount in one state, say Texas, couldn’t impact the availability of funds in Texas for these programs. The changes would be the same for the whole country at the same time.
POGO’s review, on the other hand, only considered programs for which census data influenced the amounts going to different locations (such as states, counties, or cities). It is important to understand which programs operate this way because subnational undercounts could directly impact the federal funds directed to those areas. Essentially, POGO asked a narrower question in its research than the Census Bureau did, so the result is different.
The second major difference is that the Census Bureau reviewed FY 2021 programs and spending, whereas our report examined FY 2020. POGO selected FY 2020 over FY 2021 because we plan to conduct additional research into the distribution of these funds at the subnational level and we determined that there would more data available about the distribution of these funds for FY 2020; FY 2021 funds may not be fully distributed at the subnational level yet. In addition, we were concerned that FY 2021 data would be more skewed from the norm by the large temporary COVID spending programs. There were some large COVID programs that started in FY 2020, including several that were geographically directed by census data in some way, but FY 2021 experienced an even larger increase in COVID-specific programs and funding.
Due to these differences, the Census Bureau report identified more programs totaling more money in FY 2021 than POGO did for its more tailored list of programs from FY 2020.
Full List of Assistance Programs Geographically Directed by Census Data
Below is a full list of the 338 federal financial assistance programs that we have determined to be geographically directed by census data. The list is sorted to display the programs with the largest spending first.