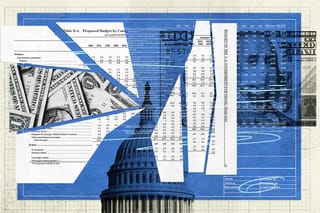
Can We Track Infrastructure Dollars?
(Illustration: Renzo Velez / POGO)
The federal government is currently implementing the infrastructure bill passed by Congress last fall. That means the government is spending $1.2 trillion over the next five years on roads, bridges, water treatment, airports, broadband internet access, and more.
Spending hundreds of billions of dollars on various infrastructure projects across the country will certainly have many people wondering how much is coming to their town. People are likely asking whether their roads and bridges will be fixed, if they’re going to get new buses or commuter train cars, or whether they can expect cheaper energy bills or more affordable broadband.
This also raises larger questions about the infrastructure spending, concerning whether the money is going where it is most needed, or if the government is leaving some communities out of infrastructure investments. There’s also the matter of how much gets done with the money. Does $1,000 get you the same amount of infrastructure (road, energy, and so on) in one state as in another? And if not, why do we get less infrastructure for our money in some states?
Even though government agencies are just starting to spend this money, we already know the answer to many of these reasonable questions will be “We don’t know.” That’s because the federal government does a poor job collecting data on federal spending, so it, Congress, and the public are often left with no answers (or incomplete answers, at best) to important questions about where and how taxpayer money is being spent.
To get accurate answers, we need to collect more details on the awards agencies make. Currently, the government allows award descriptions that tell us next to nothing about what taxpayer money is being used for. Information that is standard for contracts — things like data on the industry sector and specifics on recipient companies and their owners — is skipped over for assistance awards. The government doesn’t report details on private lenders involved in guaranteed government loan programs. There are also no requirements to report quantities related to awards (such as miles of road paved or houses connected to broadband) or the number of employees at companies receiving federal funds. Without specific details, the general information collected on federal awards only provides so much accountability.
In addition to collecting more accurate and detailed information, we also need to track the spending further. The public — and the government’s independent auditors — need to see what happens as states, counties, and cities break up the large prime awards that come directly from federal agencies into smaller payouts, or subawards, for specific projects. That level of detail would better enable us to know where road money went versus money for broadband versus money for bridges.
If we don’t follow the money further, we will never understand what was achieved with those funds.
However, the federal government only attempts to track money to the first set of subrecipients, and that data is often incomplete or inaccurate. But even when we do have accurate information about the first set of subawards, it is often insufficient to provide a real understanding of what the money was used for. Take, for example, highway funds that the Department of Transportation pays out to state transportation offices in large prime awards. The states then distribute those funds to counties for use on highways in their region. If we only follow the money to the first layer of subrecipients, then we only find out how much went to each county. We never learn which highways were worked on, which companies were hired to repair the roads, how many miles were repaved, and so on. This same pattern can play out for money allocated for energy, water, broadband, and any number of issue areas. If we don’t follow the money further, we will never understand what was achieved with those funds.
Reviewing the data available around previous programs in the major infrastructure topics provides a useful guide to what the public can expect to learn about how and where money is spent for the large spending spike authorized by the infrastructure bill.
Transportation
Transportation infrastructure — roads, bridges, trains, buses, airports, and so on — is critical to effectively move people and goods from one point to another every day in this large country. The number of cars on the roads, planes in the air, and trains rolling down tracks each day in the United States is staggering. All that volume comes with significant wear and tear that can be more obvious to the public than some of the more “behind the scenes” infrastructure sectors, like water or broadband.
The infrastructure bill allocates billions to repair and improve our nation’s transportation infrastructure. Major funding for key programs includes $36 billion for the Federal-State Partnership for Intercity Passenger Rail, $12.5 billion in National Infrastructure Investments, and $10 billion for Transit Infrastructure Grants.
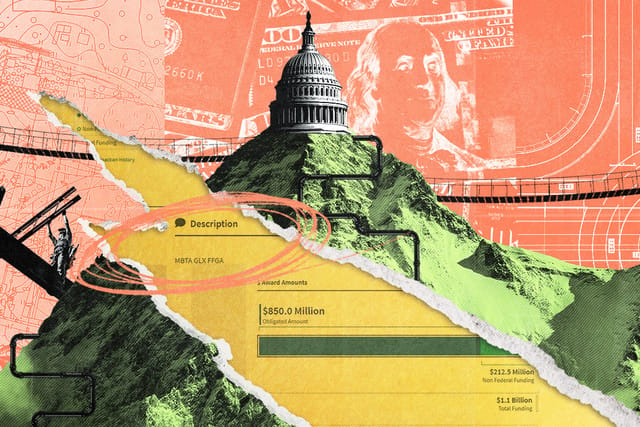
However, award reporting for previous major transportation programs often provides little detail on exactly where the funds were spent and what infrastructure improvements were achieved. Consider the $850 million grant to the Massachusetts Bay Transportation Authority under the Federal Transit Capital Investment Grants program. The award description listed for the nearly $1 billion grant is simply “MBTA GLX FFGA,” which, in addition to being a terrible slate of Scrabble tiles, is a very uninformative award description. A few searches for the triple acronym provide corresponding words for each of the letters — Massachusetts Bay Transportation Authority Green Line Extension Full Funding Grant Agreement — but even the full terms don’t shed much light on what that money was used for.
The Highway Planning and Construction program spends billions each year to maintain and improve highways in every state. According to data from USASpending.gov, the program spent $50.2 billion in fiscal year 2021, which went almost entirely to state transportation agencies. The data only indicated $3.3 billion of the money (less than 10%) as being distributed from those state agencies in subawards. And those listed subawards are all subgrants to local governments (mostly counties and cities), which means that no construction contracts are reported on tens of billions of dollars in highway construction spending.
Water
Access to clean drinking water is an absolute necessity. However, recent crises like that in Flint, Michigan, have shown that not all communities in the U.S. have access to safe, clean drinking water. The infrastructure legislation authorizes major spending on water programs, including $15 billion to replace lead pipes, $10 billion to address water contaminants, and $23.4 billion for capital grants under the Clean Water State Revolving Fund and Drinking Water State Revolving Fund.
The Clean Water State Revolving Fund has been administered by the Environmental Protection Agency for years, providing grants to states, which in turn provide low-interest loans for water infrastructure projects. According to USASpending.gov data, the program has spent $23.9 billion from fiscal year 2008 to fiscal year 2021. Despite the long-established nature of the program, the information reported on its awards does not provide much detail about what is being accomplished with the hundreds of millions in tax dollars being spent.
Many of the state grants report no subawards at all, even though the whole purpose of the program is for states to fund specific projects with the money.
Many of the state grants report no subawards at all, even though the whole purpose of the program is for states to fund specific projects with the money. For instance, a $432.6 million grant to New York State’s Department of Environmental Conservation has no subawards listed in its award history.
Other awards under the program report subawards, but may have problems with the data. For example, the California State Water Resources Control Board received $95.5 million under the Revolving Funds program, but a review of the five subawards listed in the award history perplexingly indicates the board awarded $181.6 million in subawards — which would be 190% of the prime award amount. A closer review shows two awards to Placer County that appear to have been duplicated with identical amounts, dates, and descriptions. This type of duplicated subaward is not uncommon in the data and makes it almost impossible for the public or independent inspectors general to reliably understand where money was spent. This makes it difficult to answer basic questions about the spending, and even harder to address waste or fraud in these programs.
Energy
Energy is one of the most fundamental infrastructure elements, since many of the infrastructure sectors — water, broadband, and transportation — rely on energy to function. Households need energy for lights, heating, internet, refrigeration, and more. The need for reliable energy is a fundamental component of the modern world.
The infrastructure bill funds several major energy programs that seek to modernize our use of energy, make it cleaner and more reliable, and reduce waste. These funded programs include $16 billion for Energy Efficiency and Renewable Energy, $21 billion for Clean Energy Demonstrations, and $10 billion to Prevent Electricity Outages and Upgrading Our Electric Grid.
The infrastructure bill authorizes $3.5 billion for weatherization assistance, a major energy efficiency program. Through this program, the federal government provides the states with funds to assist low-income households with weatherizing their homes to avoid heating and cooling losses, thereby reducing energy waste and lowering energy bills. According to USASpending.gov data, the program spent $283.1 million in fiscal year 2021, with the funds going to state and territory agencies in 61 large grants.
Without better data, there is no way to figure out how much is going to rural versus urban communities, or if low-income minority communities are receiving less than low-income white communities.
The good news is that many of those state agencies have reported numerous subgrants to counties. The bad news, however, is that data limitations mean the subaward data still doesn’t tell us much. The subgrants aren’t reported based on the zip codes where work is performed, so it is impossible to tell which communities the funds are tangibly benefitting. Without better data, there is no way to figure out how much is going to rural versus urban communities, or if low-income minority communities are receiving less than low-income white communities. Additionally, award descriptions for the subawards (and the prime awards) in this program fail to report how many households are being weatherized, despite that being the explicit goal of the $3.5 billion spending program. Without data on such a basic metric, there is no way to review how effective the program is. The goal is not simply to spend the money; it is to spend the money to have a particular result.
And once again, there are examples of major duplication in the reporting of subawards. For example, a $17.7 million weatherization award to the Maine Housing Authority lists 212 subawards worth $197.9 million in the award history section, which is more than 1,000% of the value of the original prime award. Sorting the subawards by amount shows that several of the largest subawards appear multiple times with the same amount, date, and recipient.
Broadband
Another focus of the bill was improving the country’s broadband infrastructure to enable more people to have affordable, easy access to fast internet. In the post-pandemic economy, with many workplaces allowing more employees to work remotely, broadband access may become one of the most important infrastructure investments the government makes.
The infrastructure bill notes that affordable and reliable high-speed broadband is often less readily available in minority, low-income, and rural communities. The law authorizes $42 billion to the Broadband Equity, Access, and Deployment Program to fund projects that address these broadband access gaps, often called the “digital divide.”
The infrastructure bill’s broadband funding will create an entirely new program to fund infrastructure investments to expand broadband access and bring down costs. However, recent previous broadband programs do not set high expectations for accountability or clarity in where funds are being spent.
The Emergency Broadband Benefit Program (EBBP) was created as a part of Congress’s response the COVID-19 pandemic. The purpose of the program was to provide assistance to help eligible low-income households pay for broadband access. As seen in this $10.6 million direct payment to Charter Communications Operating, LLC, the award description is merely “0002526580 EBBP OBLIGATION.” That pattern — a series of numbers followed by “EBBP Obligation” — is repeated for each of the program’s more than 19,000 awards. None of the provided data indicates how many families the funds assisted or what communities benefited from the assistance.
Increasing Accountability
Some level of accountability can be created through the simple act of publicly reporting information. As former chairman of the Recovery Accountability and Transparency Board, Earl Devaney oversaw almost $800 billion in economic recovery spending from the American Recovery and Reinvestment Act of 2009 and he credited transparency as the biggest lesson learned, calling it a “force multiplier in fighting fraud.” But the data being reported has to be the right information, and that information needs to be complete and accurate. Otherwise, data gaps will hamper all efforts towards transparency and spending accountability.
The data gaps in federal reporting for government spending are well known. Many of these issues have existed for years and received increased attention as the government spent trillions on COVID-19 relief. But there has been little effort to fix these problems. Without needed improvements, the infrastructure funds will continue to be spent with little clarity on what exactly the American people are getting for their money and whether the funds were used fairly and effectively.
The solutions remain clear:
- Federal funds need to be accurately reported through each subaward layer until they reach their final recipients — the communities using the assistance and the contractors doing the work.
- Better information must be collected on what funds are used for. This means requiring useful and informative award descriptions, but also collecting new information that quantifies the impact of the funds, such as the number of households assisted, miles of road repaired, and so on.
- Information collected on recipients must be expanded. Assistance awards should collect recipient data similar to what is regularly collected for contracts: information on the industry sector of recipient businesses and data on the ownership of businesses (whether minority-, woman-, or veteran-owned, for instance). For all business recipients, the number of employees should be collected.
It is only with data improvements such as these that politicians and the public alike will finally be able to get clear answers to basic questions about where these government funds are going, what the public is getting from them, and whether any communities are being left out.
Related Content