Census Matters: How Florida’s 2020 Census Undercount Affects County-Level Funding
The census directs billions of dollars to federal programs across Florida. Here’s what census-directed spending looks like in each county.
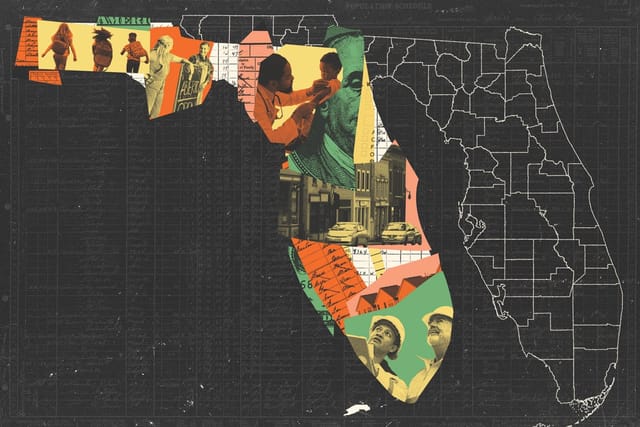
(Photos: Getty Images; Illustration: Ren Velez, Leslie Garvey / POGO
Introduction
The census is one of the most important tasks our federal government undertakes. Data collected in the decennial census determines how communities are represented in the U.S. House of Representatives, and it directs trillions of dollars in federal spending into our states, districts, counties, and cities.
To illustrate how the census shapes the flow of federal funding into communities across the country, the Project On Government Oversight (POGO) tracked 371 census-guided programs that operated in fiscal year (FY) 2023 (the most recent year for which spending data is readily available for most programs). In our report Census Matters, we broke spending down by state and found that Florida received more than $130 billion from census-guided programs.1
In this report, we narrowed the scope and tracked 24 programs, totaling more than $20.80 billion in federal spending on economic development, education, health, housing, infrastructure, and Medicaid and Medicare in the state of Florida.
We also noted that Florida was one of six states identified by the U.S. Census Bureau as having a significant undercount in the 2020 Census.
The 2030 Census is fast approaching, our next opportunity for an accurate count to help ensure the fair distribution of federal assistance funds. Elected officials and community leaders across Florida should be equipped with the information they need to advocate for a fair and accurate count in the next census.
That’s why POGO has created this report.
What We Found
In FY 2023, the 371 census-guided programs POGO tracked provided Florida with a total of $130.89 billion. These census-guided federal assistance programs are social programs primarily funded by federal taxpayer dollars and administered by the federal government to states and localities. The allocation of these program funds relies on census data to direct funding to specific geographic areas.
POGO then looked into the state of Florida more closely, following the funding for 24 of these programs — totaling $20.80 billion in federal spending — to the county level. This report details how census-driven spending made its way into communities across all counties in the state of Florida. Of the $20.80 billion, $433.83 million could not be assigned to a county due to the lack of data.
POGO spoke with more than 20 local organizations in Florida to identify the issue areas most pertinent to residents in the state and help direct our research. We’ve tracked county-level funding for these programs so advocates from all levels, from elected officials to policymakers to community leaders, are equipped with in-depth, accurate information. This information can help us all better understand how miscounts in the 2030 decennial census could affect representation and how federal funding supports communities across Florida.
Ultimately, the goal of our research is to provide federal, state, and local census advocates with the information they need to argue for an accurate, apolitical decennial census.
POGO has produced a fact sheet for every county in Florida, breaking down the spending for 24 census-guided programs. We encourage census advocates to use the fact sheets and data from this report to make the case for a complete count in 2030.
The Importance of Accurate Census Data
-
As POGO’s report Census Matters shows, trillions in federal assistance funds are distributed to states and local communities based on census data.2 Miscounts in the census can send billions of dollars to the wrong places, depriving communities of the resources they need for an entire decade. Discrepancies in this data, whether in the form of undercounts or overcounts, can disrupt the equitable allocation of resources.
For example, programs aimed at supporting school children from low-income households or aiding unhoused veterans rely on an accurate representation of those groups. If the census undercounts those subgroups, the financial support the programs deliver will likely be insufficient to adequately address the community’s needs.
The consequences of overcounts can also be harmful. For example, overcounting a population in a rural community could cause it to be redefined by the federal government as no longer rural but urban. It would then be ineligible for programs designated exclusively for rural areas. While the change in designation would make urban-focused programs available, if the area is actually still rural the mistaken designation change would likely cost the area more in needed rural funding than it might provide in new, less relevant urban funding.
The impact of any miscount is as much a function of who gets miscounted as it is the size of the miscount.
The impact of a miscount also varies depending on how the programs use census data. Eligibility thresholds, such as those that determine whether an area is designated as rural or urban, are typically less sensitive to miscounts, except for those areas near the eligibility thresholds.
But formula allocations are often more sensitive to miscounts, especially if the miscounts affect a population a program is designed to serve. For example, Title I Grants to Local Education Agencies are determined by formulas that use the number of school-age children in households with incomes below the poverty level, so a miscount of children in low-income households in one geographic area could seriously affect the amount of federal education funding sent to that area.
Even if a miscount were to inadvertently direct additional funds to a state or community, this wouldn’t be a windfall. Most census-funded programs come with strict limitations on how the funds can be used. A community receiving more funds than they should through a program for housing or job training, then, could not divert excess funds toward programs in infrastructure or health care. More importantly, the misallocation of federal money to one community would mean another community goes without. Allocation of federal funds is a zero-sum game.
The complexity and variation in the use of census data also means the exact financial impact of any errors in the census count is difficult to accurately predict. While a “per capita” loss for each person miscounted would be a persuasive data point, the complex nature of federal funding programs and the ways they use census data make that figure impossible to calculate.3
-
The Census Bureau has identified several populations that it has historically found hard to count. According to the bureau, these include:
- Young children under the age of five
- Highly mobile people
- Racial and ethnic minorities
- Non-English speakers
- Low-income people
- People experiencing homelessness
- Undocumented immigrants
- LGBTQ people
- People with mental or physical disabilities
- People who do not live in traditional housing.4
It’s important to note that there is significant overlap between the communities that the Census Bureau has designated “hard to count” and the communities that many of the programs we traced for this project are designed to serve.
These programs use census data to geographically direct funds to historically marginalized communities, including people with self-reported incomes under the federal poverty line, people living in rural communities, elderly people, people with disabilities, and Black, Indigenous, and other people of color.
To ensure that federal funding reaches the communities for which it’s intended, then, it’s critical that states, counties, and cities with significant “hard to count” populations, like Florida’s Miami-Dade county, work with the Census Bureau to intensify outreach efforts, strengthen participation, and avoid undercounts in the census process.
Statistically Significant Undercounts in Florida
As we noted above, a miscount in the census, whether it’s an undercount or overcount, can displace billions of dollars and disrupt the equitable allocation of resources.
The Census Bureau’s Post-Enumeration Survey, a follow-up survey that helps measure error rates in the decennial census results, found that Florida had a statistically significant error in the 2020 decennial census, undercounting 3.48% of the statewide population.5
According to the Census Bureau’s data, this represents approximately 749,529 Florida residents left out of the official count.6
Among individuals who were undercounted, young children age 4 and under were particularly underrepresented. At least 112,000 children in this age group were not counted in the 2020 decennial census. This undercount, which is equivalent to roughly 10% of all Florida children, could result in underfunding critical childcare development programs, like Head Start.7
Given the estimated Florida undercount of approximately 749,529 people, young children age 4 and under make up about 14.94% of the undercount population.
There are also estimated undercounts for Black residents and Hispanic residents in Florida.8 These undercounts are significant because they potentially lead to a shortfall of overall funding, and it’s often communities that have historically been discriminated against that feel funding cuts most acutely.
Census response rates play a critical role in collecting accurate data, and they are rooted in trust in our government. Everyone who provides census data is entitled to strict Title 13 protections, which ensure that any data collected from respondents is confidential and that government staff privy to such data will face penalties if they violate that confidence.
Miscounts in Florida’s 2020 Census highlight the need for stronger preparations ahead of the 2030 Census to ensure a full and accurate count. The state government and local officials across Florida must work proactively to prevent repeating past miscounting errors and potential underfunding across counties.
How the Census Shapes Spending
POGO’s list of 24 programs includes only those that use census data to allocate at least some portion of federal funds managed by the program to specific geographic locations. These programs use census data in four main ways to help guide funding:
- Eligibility criteria – the use of census data to determine which locations or recipients may receive funds from a program. For example, census population data determines which areas count as urban or rural. In Florida, areas classified as urban would qualify for the Federal Transit Urbanized Area Formula Grants program.
- Allocation formulas – the use of census data within a program formula to determine the level of funding a location or recipient receives. For example, in Florida, the Community Development Block Grant uses percentages of population, housing, and income data to assign funds accordingly.
- Application evaluations – the use of census data to score or prioritize funding applications. In Florida, for example, the Water and Waste Disposal Systems for Rural Communities program prioritizes an application serving populations less than 2,500.
- Loan interest rates – Some federal assistance loan programs use census data in setting the interest rates on the loans they offer or guarantee. None of the 24 programs POGO tracked to the county level in Florida uses census data this way. However, Floridians benefit from programs that do. For example, the USDA Community Facilities Direct Loan & Grant Program, through which eligible Florida communities can apply for facility funding, uses census data to determine interest rates.
Types of Spending
Based on conversations with advocates in the state, POGO assigned each of the 24 programs to one of five categories based on their primary purpose: Health, Infrastructure, Education, Economic Development, and Housing. Here’s what we found:
$10.03 billion in census-guided Health spending occurred in FY 2023. These programs provide nutritional support, social services, child development services, and more. POGO tracked census-directed health spending in Florida for the following programs: Child Care and Development Block Grant, National School Lunch Program, School Breakfast Program, and the Supplemental Nutrition Assistance Program (SNAP).9
$3.58 billion in census-guided Infrastructure spending occurred in FY 2023. These programs provide funds for roads, bridges, energy production, broadband, water treatment, and other community infrastructure projects. POGO tracked census-directed infrastructure spending in Florida through the following programs: Federal Transit Formula Grants, Highway Planning and Construction, Schools and Libraries Universal Service Fund (E-Rate), Disposal Systems for Rural Communities, and Capitalization Grants – Clean Water State Revolving Fund.
$2.30 billion in census-guided Education spending occurred in FY 2023. In Florida, these programs support primary education, special education, and training and education for community members. POGO tracked census-directed education spending in Florida through the following programs: Head Start, Title I Grants to LEAs, and Special Education Grants to States.
$2.31 billion in census-guided Economic Development spending occurred in FY 2023. These programs provide loans for business expansions, small business assistance, employment services for workers, and other efforts to improve the economic well-being of individuals and communities. POGO tracked census-directed economic development spending in Florida through the following programs: Workforce Innovation and Opportunity Act (WIOA) Adult, WIOA Dislocated Workers, WIOA Youth, Community Development Block Grant, 7(a) Loan Guaranty, and Unemployment Insurance.
$2.58 billion in census-guided Housing spending occurred in FY 2023. These programs assist homeowners and renters with housing costs, invest in public housing improvements, and help veterans, the elderly, people with disabilities, and others find affordable housing. POGO tracked census-directed housing spending in Florida through the following programs: Project Based Rental Assistance, Housing Choice Voucher Program, Very Low to Moderate Income Housing Loans – Section 502, Public Housing Capital Fund, Home Investment Partnership, and Continuum of Care.
Spending by County
POGO’s research showed that the statewide distribution of funds varied across Florida. While more populous counties in Florida, like Miami-Dade and Broward, received more federal funds than less populous counties, like Lafayette and Liberty, census-guided spending is driven by more than just population.
Variances in the poverty rate, the percentage of populations living in rural areas, demographic-specific characteristics, median income, education attainment, and more affect how federal funding is geographically distributed.10 These variances allow federal assistance programs that use census data to allocate resources more effectively and equitably, ensuring support reaches low-income and rural communities.
The five spending categories POGO tracked reflect how significantly census data impacts each and every community in Florida. The 24 programs we tracked alone account for $20.80 billion in federal spending across the state.
The table below lists the amounts distributed to each county through the 24 programs that use census data to geographically distribute federal funds. It is important to note that these county-level spending data figures are estimates, and improvements in federal spending data are necessary to better evaluate the impact of census data on the geographic distribution of federal funds.
For more details on the spending breakdown in each county, please see the county-specific fact sheets above.
-
POGO consulted with more than 20 local organizations to identify programs that serve communities in Florida. To generate county breakdowns of the census-guided federal funding for these programs, POGO sourced publicly available data and submitted Freedom of Information Act (FOIA) public records requests for data that was not widely available.
However, even after those efforts, there are some programs for which we needed to create our own methodology to estimate how much each county received based on each county’s average rate of payments or spending pattern and apply that to the total amount.
Below are the sources and methods POGO used to calculate the total FY 2023 spending for each program.
USAspending.gov
The website USAspending.gov is the primary government website to access federal award data, including contracts, grants, direct payments, and loans. POGO sourced spending data for five programs from USAspending.gov, using the place of performance for prime awards to calculate spending totals for each state. This covers $510.54 million in spending, or about 2.5% of the funding tracked in this report.
Federal Agency Sources
POGO used spending data posted by federal agencies overseeing 11 of the 24 programs to produce Florida’s county-specific allocations totals. These sources include agency-based award datasets, program reports, labor statistics, and more. The 11 programs cover $16.13 billion, or about 77.6% of the funding tracked in this report.
State Agency Sources
POGO received substantive responses, such as expenditure data spreadsheets, to three FOIA requests from Florida’s Department of Agriculture and Department of Education. FOIA requests are typically submitted when spending data is not publicly or readily available.
Spending data posted by the agencies overseeing census-guided programs was also used to produce county-specific allocation totals. This publicly available data includes agency-based award datasets, county financial auditor reports, school district annual financial reports, county board meetings, program reports, and more.
Altogether, data for eight of the 24 programs originated from state agency sources. This covers $4.15 billion, or about 20% of the funding tracked in this report.
Special Education Grants to States Program: A Fiscal Year Exception
All the programs that POGO has tracked measure spending for FY 2023 (October 1, 2022 – September 30, 2023), except for one: the Special Education Grants to States program. That program follows the Florida state fiscal year, which began July 1, 2022, and ended June 30, 2023. POGO decided to use the state fiscal year spending data to estimate county spending because the difference between the total federal amount for that year and the county spending total we tracked was negligible.
Related Content